Global Plastic Compounding Market By Product Forecast (2015-2023)

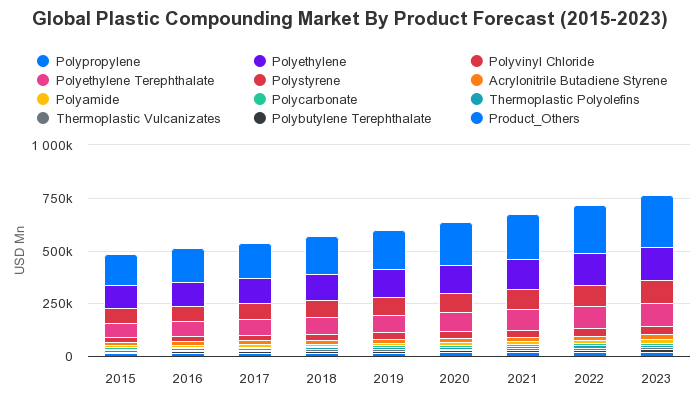
Created with Highcharts 11.4.0YearUSD MnChart context menuGlobal Plastic Compounding Market By Product Forecast(2015-2023)484 096.7484 096.7509 614.9509 614.9536 724.4536 724.4566 493.8566 493.8599 090.4599 090.4634 128.5634 128.5674 191.1674 191.1716 911.2716 911.2762 472.6762 472.6149 675.6158 360.2167 604.7177 748.9188 854.6200 808.8214 440.6229 010.8244 585.2108 574.1113 209118 093.4123 451.1129 302.9135 549.9142 725.6150 304.3158 309.969 504.273 028.776 765.480 865.485 35090 161.895 664.9101 519.6107 749.264 761.268 968.573 481.378 456.283 930.989 865.796 644.7103 951111 826.924 593.225 811.127 101.128 516.330 063.731 722.733 620.835 638.137 782.215 981.916 684.817 426.118 239.219 127.320 076.221 165.122 316.523 534.110 337.910 81211 312.811 861.912 46213 103.813 839.414 618.515 443.95 977.66 303.26 649.57 029.77 446.17 894.18 405.98 952.39 535.78 074.28 455.78 8599 301.49 784.810 302.410 895.211 523.812 190.66 266.96 611.46 977.87 380.37 821.18 295.68 837.59 416.410 034.77 803.88 102.28 415.78 759.99 135.99 536.49 998.310 484.210 995.412 546.113 268.114 037.614 883.515 811.116 811.117 953.119 175.720 484.82015201620172018201920202021202220230200k400k600k800k1 000k
Year POLYPROPYLENE POLYETHYLENE POLYVINYL CHLORIDE POLYETHYLENE TEREPHTHALATE POLYSTYRENE ACRYLONITRILE BUTADIENE STYRENE POLYAMIDE POLYCARBONATE THERMOPLASTIC POLYOLEFINS THERMOPLASTIC VULCANIZATES POLYBUTYLENE TEREPHTHALATE PRODUCT_OTHERS
2015 $ 149675.6 $ 108574.1 $ 69504.2 $ 64761.2 $ 24593.2 $ 15981.9 $ 10337.9 $ 5977.6 $ 8074.2 $ 6266.9 $ 7803.8 $ 12546.1
2016 $ 158360.2 $ 113209.0 $ 73028.7 $ 68968.5 $ 25811.1 $ 16684.8 $ 10812.0 $ 6303.2 $ 8455.7 $ 6611.4 $ 8102.2 $ 13268.1
2017 $ 167604.7 $ 118093.4 $ 76765.4 $ 73481.3 $ 27101.1 $ 17426.1 $ 11312.8 $ 6649.5 $ 8859.0 $ 6977.8 $ 8415.7 $ 14037.6
2018 $ 177748.9 $ 123451.1 $ 80865.4 $ 78456.2 $ 28516.3 $ 18239.2 $ 11861.9 $ 7029.7 $ 9301.4 $ 7380.3 $ 8759.9 $ 14883.5
2019 $ 188854.6 $ 129302.9 $ 85350.0 $ 83930.9 $ 30063.7 $ 19127.3 $ 12462.0 $ 7446.1 $ 9784.8 $ 7821.1 $ 9135.9 $ 15811.1
2020 $ 200808.8 $ 135549.9 $ 90161.8 $ 89865.7 $ 31722.7 $ 20076.2 $ 13103.8 $ 7894.1 $ 10302.4 $ 8295.6 $ 9536.4 $ 16811.1
2021 $ 214440.6 $ 142725.6 $ 95664.9 $ 96644.7 $ 33620.8 $ 21165.1 $ 13839.4 $ 8405.9 $ 10895.2 $ 8837.5 $ 9998.3 $ 17953.1
2022 $ 229010.8 $ 150304.3 $ 101519.6 $ 103951.0 $ 35638.1 $ 22316.5 $ 14618.5 $ 8952.3 $ 11523.8 $ 9416.4 $ 10484.2 $ 19175.7
2023 $ 244585.2 $ 158309.9 $ 107749.2 $ 111826.9 $ 37782.2 $ 23534.1 $ 15443.9 $ 9535.7 $ 12190.6 $ 10034.7 $ 10995.4 $ 20484.8
  • To Get Uninterrupted Charts Access Please Subscribe
  • Dedicated Client Service Manager
  • Dedicated Analyst Support
  • View access to 2 million data
Global Plastic Compounding Market By Product Forecast (2015-2023)

Synopsis
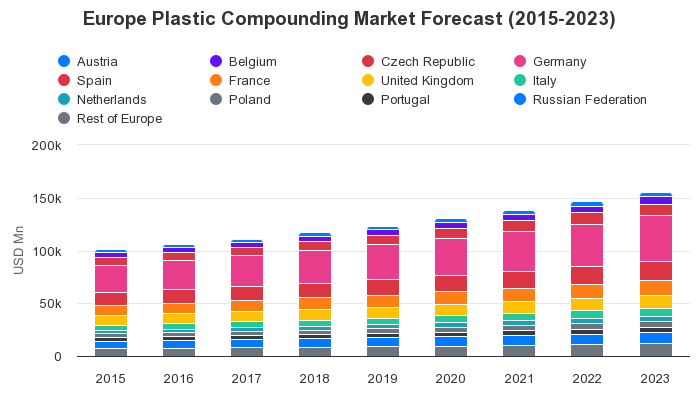
The above chart is Global Plastic Compounding market [2015-2023] by Product

Market Dynamics

polypropylene segment accounted for the largest market share in the plastic compounding market, and is expected to reach usd 244585.20 million in 2023 from usd 158360.20 million in 2016. however, polyethylene terephthalate segment is the fastest growing market, which is expected to grow at a cagr of 7.25% during the forecast period 2017 - 2023.

Further Content:You might find this interesting as well

Industries List

SINGLE SEAT SOLUTIONS FOR INDIVIDUALS AND SMALL BUSINESSES
Efficient research: Relevant data available at a click

Starter Account

$49 USD/month

* Billed Annually

  • Download XLS, PNG & PPT
  • View Access to 1 Million Data
  • View Access to Entire Platform
Single User Account

$599 USD/month

* Billed Annually

  • Dedicated Client Service Manager
  • Download XLS, PNG & PPT
  • View access to 2 million data
  • View Access to Entire Platform

Business Account

$899 USD/month

* Billed Annually

  • Dedicated Client Service Manager
  • Dedicated Analyst Support
  • Suggestive request box to accommodate new markets during subscription period
  • Access to the entire data & statistics with download rights for up to 10000 Premium statistics per 12 months without publication rights
  • View Access to Entire Platform
CONTACT

Closebutton

Stay Ahead with Exclusive Data!

Subscribe Now to Access Our Market Research Platform,and Charts
for B2B and B2C Industries. Empower Your Business with Insights