Global Plastic Compounding Market By Application Forecast (2015-2023)

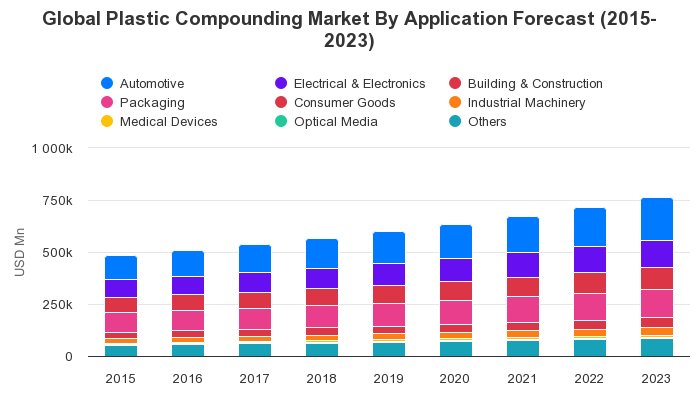
Created with Highcharts 11.4.0YearUSD MnChart context menuGlobal Plastic Compounding Market By ApplicationForecast (2015-2023)484 096.7484 096.7509 614.8509 614.8536 724.2536 724.2566 494566 494599 090.5599 090.5634 128.3634 128.3674 191.2674 191.2716 911.3716 911.3762 472.7762 472.7115 452.8123 413.4131 945.1141 330.7151 640.2162 803.9175 519.4189 214.4203 964.686 365.790 522.994 921.699 746.3105 020.1110 669117 136.1124 000.3131 28771 013.774 199.977 56381 251.385 280.589 587.594 527.199 754.4105 287.193 964.697 948102 144.8106 748.6111 776.8117 143.7123 309.9129 820.6136 696.229 60431 137.532 764.634 550.436 504.238 602.241 000.843 555.146 275.823 382.424 563.425 815.427 189.128 691.530 303.332 146.934 107.936 1945 850.56 217.36 609.97 042.47 517.78 0328 619.59 251.39 930.94 153.94 382.74 6264 893.35 186.15 501.25 861.26 245.76 656.454 309.157 229.760 333.863 741.967 473.471 485.576 070.380 961.686 180.72015201620172018201920202021202220230200k400k600k800k1 000k
Year AUTOMOTIVE ELECTRICAL & ELECTRONICS BUILDING & CONSTRUCTION PACKAGING CONSUMER GOODS INDUSTRIAL MACHINERY MEDICAL DEVICES OPTICAL MEDIA OTHERS
2015 $ 115452.8 $ 86365.7 $ 71013.7 $ 93964.6 $ 29604.0 $ 23382.4 $ 5850.5 $ 4153.9 $ 54309.1
2016 $ 123413.4 $ 90522.9 $ 74199.9 $ 97948.0 $ 31137.5 $ 24563.4 $ 6217.3 $ 4382.7 $ 57229.7
2017 $ 131945.1 $ 94921.6 $ 77563.0 $ 102144.8 $ 32764.6 $ 25815.4 $ 6609.9 $ 4626.0 $ 60333.8
2018 $ 141330.7 $ 99746.3 $ 81251.3 $ 106748.6 $ 34550.4 $ 27189.1 $ 7042.4 $ 4893.3 $ 63741.9
2019 $ 151640.2 $ 105020.1 $ 85280.5 $ 111776.8 $ 36504.2 $ 28691.5 $ 7517.7 $ 5186.1 $ 67473.4
2020 $ 162803.9 $ 110669.0 $ 89587.5 $ 117143.7 $ 38602.2 $ 30303.3 $ 8032.0 $ 5501.2 $ 71485.5
2021 $ 175519.4 $ 117136.1 $ 94527.1 $ 123309.9 $ 41000.8 $ 32146.9 $ 8619.5 $ 5861.2 $ 76070.3
2022 $ 189214.4 $ 124000.3 $ 99754.4 $ 129820.6 $ 43555.1 $ 34107.9 $ 9251.3 $ 6245.7 $ 80961.6
2023 $ 203964.6 $ 131287.0 $ 105287.1 $ 136696.2 $ 46275.8 $ 36194.0 $ 9930.9 $ 6656.4 $ 86180.7
  • To Get Uninterrupted Charts Access Please Subscribe
  • Dedicated Client Service Manager
  • Dedicated Analyst Support
  • View access to 2 million data
Global Plastic Compounding Market By Application Forecast (2015-2023)

Synopsis
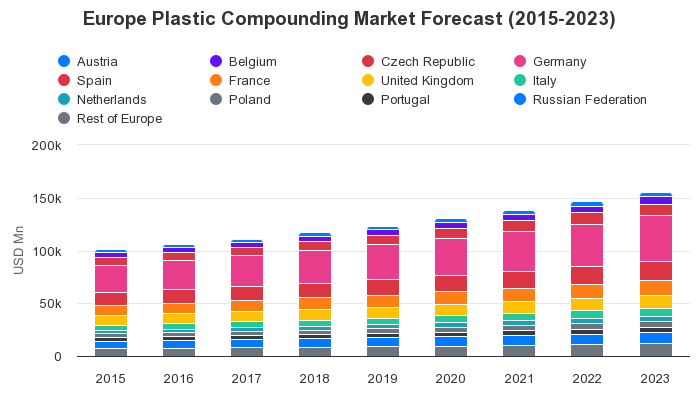
The above chart is Global Plastic Compounding market [2015-2023] by Application

Market Dynamics

automotive segment accounted for the largest market share in the plastic compounding market, and is expected to reach usd 203964.60 million in 2023 from usd 123413.40 million in 2016.this market is projected to grow at a cagr of 7.53% during the forecast period from 2017 - 2023.

Further Content:You might find this interesting as well

Industries List

SINGLE SEAT SOLUTIONS FOR INDIVIDUALS AND SMALL BUSINESSES
Efficient research: Relevant data available at a click

Starter Account

$49 USD/month

* Billed Annually

  • Download XLS, PNG & PPT
  • View Access to 1 Million Data
  • View Access to Entire Platform
Single User Account

$625 USD/month

* Billed Annually

  • Dedicated Client Service Manager
  • Download XLS, PNG & PPT
  • View access to 2 million data
  • View Access to Entire Platform

Business Account

$899 USD/month

* Billed Annually

  • Dedicated Client Service Manager
  • Dedicated Analyst Support
  • Suggestive request box to accommodate new markets during subscription period
  • Access to the entire data & statistics with download rights for up to 10000 Premium statistics per 12 months without publication rights
  • View Access to Entire Platform
CONTACT

Closebutton

Stay Ahead with Exclusive Data!

Subscribe Now to Access Our Market Research Platform,and Charts
for B2B and B2C Industries. Empower Your Business with Insights