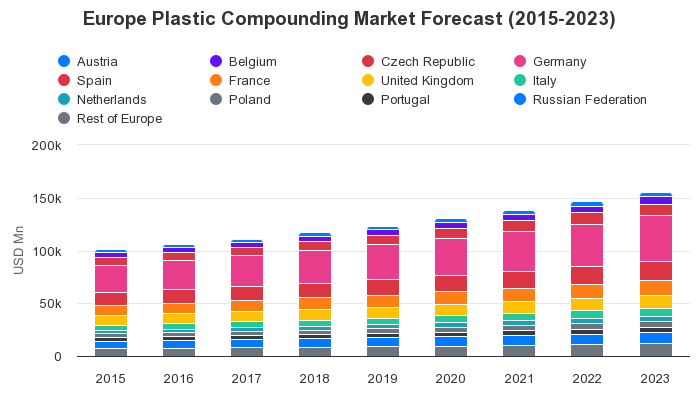
Europe Plastic Compounding Market By Application Forecast (2015-2023)

Created with Highcharts 11.4.0YearUSD MnChart context menuEurope Plastic Compounding Market By ApplicationForecast (2015-2023)100 962.82100 962.82105 988.84105 988.84111 313.76111 313.76117 155.38117 155.38123 543.37123 543.37130 393.12130 393.12138 229.65138 229.65146 559.8146 559.8155 415.89155 415.8924 420.8125 694.3227 045.528 527.8230 149.2831 889.9833 879.2735 997.4738 253.2218 221.8919 124.2520 080.0721 128.6122 275.1423 504.3324 910.7526 405.3927 994.0315 069.8815 771.3816 512.7617 325.8518 214.3319 165.0420 254.3221 408.8222 632.6119 331.9320 250.9821 22322 289.0823 454.2424 701.8126 130.4827 646.0529 254.035 880.376 171.576 480.036 818.47 188.47 585.078 038.938 521.279 033.944 495.34 741.495 003.375 290.955 605.955 944.886 332.16 745.597 187.18397.49421.11446.33474.07504.51537.37574.89615.14658.3333.42352.34372.5394.65418.93445.09474.97506.93541.1312 811.7313 461.414 150.214 905.9515 732.5916 619.5517 633.9418 713.1419 861.45201520162017201820192020202120222023025k50k75k100k125k150k175k
Year AUTOMOTIVE ELECTRICAL & ELECTRONICS BUILDING & CONSTRUCTION PACKAGING CONSUMER GOODS INDUSTRIAL MACHINERY MEDICAL DEVICES OPTICAL MEDIA OTHERS
2015 $ 24420.81 $ 18221.89 $ 15069.88 $ 19331.93 $ 5880.37 $ 4495.3 $ 397.49 $ 333.42 $ 12811.73
2016 $ 25694.32 $ 19124.25 $ 15771.38 $ 20250.98 $ 6171.57 $ 4741.49 $ 421.11 $ 352.34 $ 13461.4
2017 $ 27045.5 $ 20080.07 $ 16512.76 $ 21223.0 $ 6480.03 $ 5003.37 $ 446.33 $ 372.5 $ 14150.2
2018 $ 28527.82 $ 21128.61 $ 17325.85 $ 22289.08 $ 6818.4 $ 5290.95 $ 474.07 $ 394.65 $ 14905.95
2019 $ 30149.28 $ 22275.14 $ 18214.33 $ 23454.24 $ 7188.4 $ 5605.95 $ 504.51 $ 418.93 $ 15732.59
2020 $ 31889.98 $ 23504.33 $ 19165.04 $ 24701.81 $ 7585.07 $ 5944.88 $ 537.37 $ 445.09 $ 16619.55
2021 $ 33879.27 $ 24910.75 $ 20254.32 $ 26130.48 $ 8038.93 $ 6332.1 $ 574.89 $ 474.97 $ 17633.94
2022 $ 35997.47 $ 26405.39 $ 21408.82 $ 27646.05 $ 8521.27 $ 6745.59 $ 615.14 $ 506.93 $ 18713.14
2023 $ 38253.22 $ 27994.03 $ 22632.61 $ 29254.03 $ 9033.94 $ 7187.18 $ 658.3 $ 541.13 $ 19861.45
  • To Get Uninterrupted Charts Access Please Subscribe
  • Dedicated Client Service Manager
  • Dedicated Analyst Support
  • View access to 2 million data
Europe Plastic Compounding Market By Application Forecast (2015-2023)

Synopsis
The above chart is Global Plastic Compounding market [2015-2023] Europe by Application

Market Dynamics

automotive segment accounted for the largest market share in 2016, this market is expected to reach usd 38253.22 million in 2023 from usd 25694.32 million in 2016. this market is projected to grow at a cagr of 5.95% during the forecast period from 2017 - 2023. however, medical devices segment is the fastest growing market, which is expected to grow at a cagr of 6.69% during the forecast period 2017 - 2023.

Further Content:You might find this interesting as well

Industries List

SINGLE SEAT SOLUTIONS FOR INDIVIDUALS AND SMALL BUSINESSES
Efficient research: Relevant data available at a click

Starter Account

$49 USD/month

* Billed Annually

  • Download XLS, PNG & PPT
  • View Access to 1 Million Data
  • View Access to Entire Platform
Single User Account

$625 USD/month

* Billed Annually

  • Dedicated Client Service Manager
  • Download XLS, PNG & PPT
  • View access to 2 million data
  • View Access to Entire Platform

Business Account

$899 USD/month

* Billed Annually

  • Dedicated Client Service Manager
  • Dedicated Analyst Support
  • Suggestive request box to accommodate new markets during subscription period
  • Access to the entire data & statistics with download rights for up to 10000 Premium statistics per 12 months without publication rights
  • View Access to Entire Platform
CONTACT

Closebutton

Stay Ahead with Exclusive Data!

Subscribe Now to Access Our Market Research Platform,and Charts
for B2B and B2C Industries. Empower Your Business with Insights