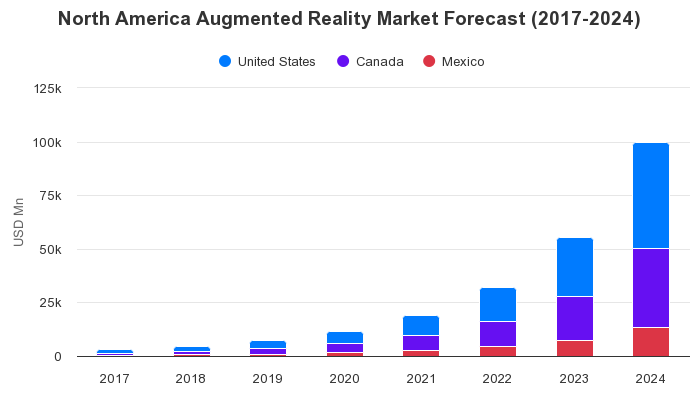
North America Augmented Reality Market By Vertical Forecast (2017-2024)

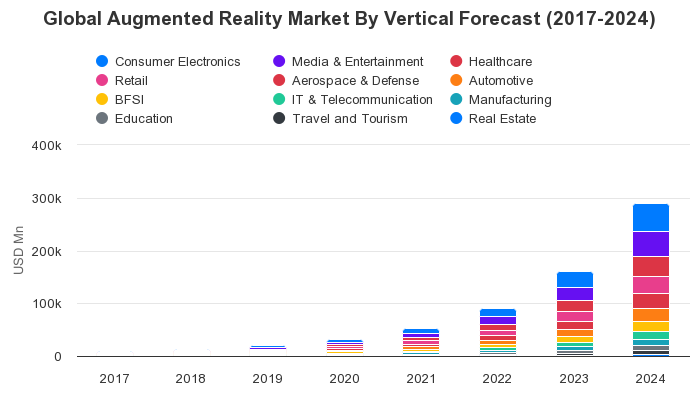
Created with Highcharts 11.4.0YearUSD MnChart context menuNorth America Augmented Reality Market By VerticalForecast (2017-2024)3 128.583 128.584 729.674 729.677 331.237 331.2311 665.9111 665.9119 080.9819 080.9832 119.8232 119.8255 717.7355 717.7399 729.2299 729.22479.81749.711 196.031 951.293 260.85 590.069 845.8517 843.3415.62646.341 030.611 687.032 838.514 915.298 771.1316 149.94385.39589.84925.621 491.172 469.224 208.067 390.1313 391.53352.82535.88834.531 334.172 192.413 707.856 462.0411 620.53316.91477.81738.661 172.271 912.283 210.455 554.279 915.11258.14386.51593.36935.141 514.862 525.584 339.097 692.09239.61355.15539.73842.041 350.282 228.443 789.856 650.41198.97292.92442.15685.161 091.321 788.973 022.045 267.53164.98240.32358.92550.3867.271 406.672 351.164 054.91140.05202.72300.87458.41717.911 157.111 921.893 293.75104.57150.25221.36334.79520.45832.691 372.892 335.5971.71102.22149.39224.14345.67548.65897.391 514.53201720182019202020212022202320240100k25k50k75k125k
Year CONSUMER ELECTRONICS MEDIA & ENTERTAINMENT HEALTHCARE RETAIL AEROSPACE & DEFENSE AUTOMOTIVE BFSI IT & TELECOMMUNICATION MANUFACTURING EDUCATION TRAVEL AND TOURISM REAL ESTATE
2017 $ 479.81 $ 415.62 $ 385.39 $ 352.82 $ 316.91 $ 258.14 $ 239.61 $ 198.97 $ 164.98 $ 140.05 $ 104.57 $ 71.71
2018 $ 749.71 $ 646.34 $ 589.84 $ 535.88 $ 477.81 $ 386.51 $ 355.15 $ 292.92 $ 240.32 $ 202.72 $ 150.25 $ 102.22
2019 $ 1196.03 $ 1030.61 $ 925.62 $ 834.53 $ 738.66 $ 593.36 $ 539.73 $ 442.15 $ 358.92 $ 300.87 $ 221.36 $ 149.39
2020 $ 1951.29 $ 1687.03 $ 1491.17 $ 1334.17 $ 1172.27 $ 935.14 $ 842.04 $ 685.16 $ 550.3 $ 458.41 $ 334.79 $ 224.14
2021 $ 3260.8 $ 2838.51 $ 2469.22 $ 2192.41 $ 1912.28 $ 1514.86 $ 1350.28 $ 1091.32 $ 867.27 $ 717.91 $ 520.45 $ 345.67
2022 $ 5590.06 $ 4915.29 $ 4208.06 $ 3707.85 $ 3210.45 $ 2525.58 $ 2228.44 $ 1788.97 $ 1406.67 $ 1157.11 $ 832.69 $ 548.65
2023 $ 9845.85 $ 8771.13 $ 7390.13 $ 6462.04 $ 5554.27 $ 4339.09 $ 3789.85 $ 3022.04 $ 2351.16 $ 1921.89 $ 1372.89 $ 897.39
2024 $ 17843.3 $ 16149.94 $ 13391.53 $ 11620.53 $ 9915.11 $ 7692.09 $ 6650.41 $ 5267.53 $ 4054.91 $ 3293.75 $ 2335.59 $ 1514.53
  • To Get Uninterrupted Charts Access Please Subscribe
  • Dedicated Client Service Manager
  • Dedicated Analyst Support
  • View access to 2 million data
North America Augmented Reality Market By Vertical Forecast (2017-2024)

Synopsis
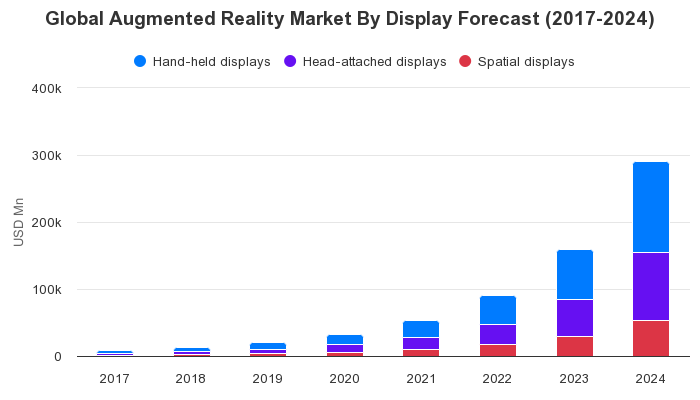
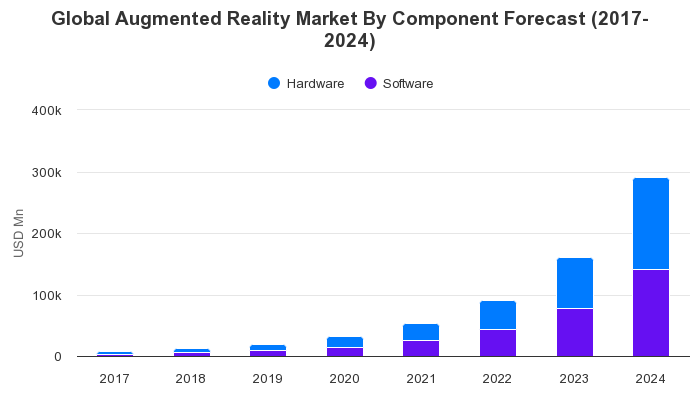
The above chart is Global Augmented Reality market [2017-2024] North America by Vertical

Market Dynamics

Consumer electronics segment accounted for the largest market share in 2018, this market is expected to reach usd 17843.30 million in 2024 from usd 749.71 million in 2018. this market is projected to grow at a cagr of 71.69% during the forecast period from 2019 - 2024. however, media and entertainment segment is the fastest growing market, which is expected to grow at a cagr of 73.39% during the forecast period 2019 - 2024.

Further Content:You might find this interesting as well

Industries List

SINGLE SEAT SOLUTIONS FOR INDIVIDUALS AND SMALL BUSINESSES
Efficient research: Relevant data available at a click

Starter Account

$49 USD/month

* Billed Annually

  • Download XLS, PNG & PPT
  • View Access to 1 Million Data
  • View Access to Entire Platform

Single User Account

$625 USD/month

* Billed Annually

  • Dedicated Client Service Manager
  • Download XLS, PNG & PPT
  • View access to 2 million data
  • View Access to Entire Platform

Business Account

$899 USD/month

* Billed Annually

  • Dedicated Client Service Manager
  • Dedicated Analyst Support
  • Suggestive request box to accommodate new markets during subscription period
  • Access to the entire data & statistics with download rights for up to 10000 Premium statistics per 12 months without publication rights
  • View Access to Entire Platform
CONTACT

Closebutton

Stay Ahead with Exclusive Data!

Subscribe Now to Access Our Market Research Platform,and Charts
for B2B and B2C Industries. Empower Your Business with Insights