Global Ammonia Market By Application Forecast (2013-2028)

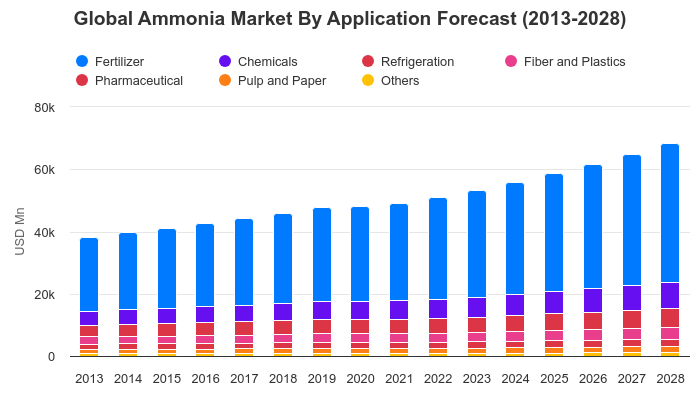
Created with Highcharts 11.4.0YearUSD MnChart context menuGlobal Ammonia Market By Application Forecast (2013-2028)38 213.338 213.339 749.939 749.941 164.441 164.442 59542 59544 205.144 205.146 003.446 003.447 930.747 930.748 181.848 181.849 175.749 175.751 058.651 058.653 232.153 232.156 060.356 060.358 922.458 922.461 806.661 806.664 97564 97568 354.568 354.523 618.324 664.925 64226 635.227 74728 984.130 310.330 580.631 324.132 639.734 149.236 088.838 061.940 060.842 25644 601.44 579.34 7704 946.35 1255 325.55 549.15 788.75 8265 953.26 188.26 458.96 809.57 164.77 523.27 916.98 336.93 746.43 875.63 991.44 107.14 238.64 386.34 544.34 542.24 609.54 758.64 932.75 164.85 3975 628.25 882.16 151.62 311.62 3852 449.72 5142 587.62 670.62 759.42 750.82 784.22 866.62 963.53 094.73 225.23 354.43 496.43 646.91 747.71 788.71 822.51 855.41 894.41 939.51 9881 965.91 973.82 0162 067.42 141.62 214.12 284.32 361.92 443.91 314.61 351.51 383.21 414.51 450.71 491.91 5361 525.81 538.81 578.71 626.31 692.21 757.31 821.21 891.51 965.9895.4914.2929.3943.8961.3981.91 004990.5992.11 010.81 034.11 068.71 102.21 134.51 170.21 207.92013201420152016201720182019202020212022202320242025202620272028020k40k60k80k
Year FERTILIZER CHEMICALS REFRIGERATION FIBER AND PLASTICS PHARMACEUTICAL PULP AND PAPER OTHERS
2013 $ 23618.3 $ 4579.3 $ 3746.4 $ 2311.6 $ 1747.7 $ 1314.6 $ 895.4
2014 $ 24664.9 $ 4770.0 $ 3875.6 $ 2385.0 $ 1788.7 $ 1351.5 $ 914.2
2015 $ 25642.0 $ 4946.3 $ 3991.4 $ 2449.7 $ 1822.5 $ 1383.2 $ 929.3
2016 $ 26635.2 $ 5125.0 $ 4107.1 $ 2514.0 $ 1855.4 $ 1414.5 $ 943.8
2017 $ 27747.0 $ 5325.5 $ 4238.6 $ 2587.6 $ 1894.4 $ 1450.7 $ 961.3
2018 $ 28984.1 $ 5549.1 $ 4386.3 $ 2670.6 $ 1939.5 $ 1491.9 $ 981.9
2019 $ 30310.3 $ 5788.7 $ 4544.3 $ 2759.4 $ 1988.0 $ 1536.0 $ 1004.0
2020 $ 30580.6 $ 5826.0 $ 4542.2 $ 2750.8 $ 1965.9 $ 1525.8 $ 990.5
2021 $ 31324.1 $ 5953.2 $ 4609.5 $ 2784.2 $ 1973.8 $ 1538.8 $ 992.1
2022 $ 32639.7 $ 6188.2 $ 4758.6 $ 2866.6 $ 2016.0 $ 1578.7 $ 1010.8
2023 $ 34149.2 $ 6458.9 $ 4932.7 $ 2963.5 $ 2067.4 $ 1626.3 $ 1034.1
2024 $ 36088.8 $ 6809.5 $ 5164.8 $ 3094.7 $ 2141.6 $ 1692.2 $ 1068.7
2025 $ 38061.9 $ 7164.7 $ 5397.0 $ 3225.2 $ 2214.1 $ 1757.3 $ 1102.2
2026 $ 40060.8 $ 7523.2 $ 5628.2 $ 3354.4 $ 2284.3 $ 1821.2 $ 1134.5
2027 $ 42256.0 $ 7916.9 $ 5882.1 $ 3496.4 $ 2361.9 $ 1891.5 $ 1170.2
2028 $ 44601.4 $ 8336.9 $ 6151.6 $ 3646.9 $ 2443.9 $ 1965.9 $ 1207.9
  • To Get Uninterrupted Charts Access Please Subscribe
  • Dedicated Client Service Manager
  • Dedicated Analyst Support
  • View access to 2 million data
Global Ammonia Market By Application Forecast (2013-2028)

Synopsis
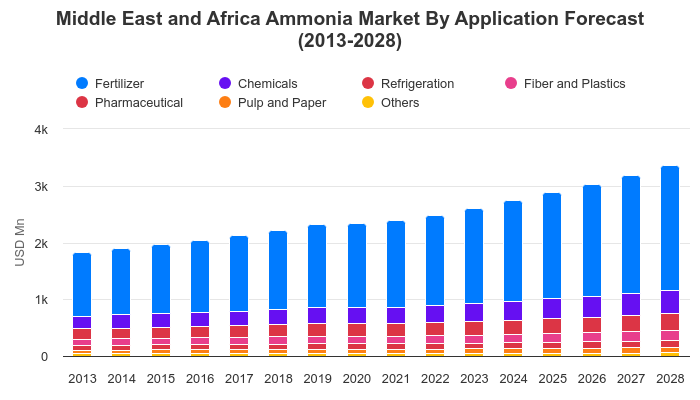
The above chart is Global Ammonia market [2013-2028] by Application

Market Dynamics

fertilizer segment accounted for the largest market share in the ammonia market, and is expected to reach usd 44601.40 million in 2028 from usd 28984.10 million in 2018.this market is projected to grow at a cagr of 4.39% during the forecast period from 2019 - 2028.

Further Content:You might find this interesting as well

Industries List

SINGLE SEAT SOLUTIONS FOR INDIVIDUALS AND SMALL BUSINESSES
Efficient research: Relevant data available at a click

Starter Account

$49 USD/month

* Billed Annually

  • Download XLS, PNG & PPT
  • View Access to 1 Million Data
  • View Access to Entire Platform

Single User Account

$625 USD/month

* Billed Annually

  • Dedicated Client Service Manager
  • Download XLS, PNG & PPT
  • View access to 2 million data
  • View Access to Entire Platform

Business Account

$899 USD/month

* Billed Annually

  • Dedicated Client Service Manager
  • Dedicated Analyst Support
  • Suggestive request box to accommodate new markets during subscription period
  • Access to the entire data & statistics with download rights for up to 10000 Premium statistics per 12 months without publication rights
  • View Access to Entire Platform
CONTACT

Closebutton

Stay Ahead with Exclusive Data!

Subscribe Now to Access Our Market Research Platform,and Charts
for B2B and B2C Industries. Empower Your Business with Insights