Asia Pacific Silicon Dioxide Market Forecast (2015-2030)

Created with Highcharts 11.4.0YearUSD KChart context menuAsia Pacific Silicon Dioxide Market Forecast (2015-2030)2 545 331.92 545 331.92 702 880.52 702 880.52 871 436.12 871 436.13 057 0063 057 0063 260 897.83 260 897.83 481 417.23 481 417.23 733 243.93 733 243.94 003 904.24 003 904.24 294 849.64 294 849.64 607 647.24 607 647.24 943 988.34 943 988.35 305 699.25 305 699.25 694 7515 694 7516 113 273.16 113 273.16 563 564.76 563 564.77 048 109.87 048 109.81 481 984.71 581 185.11 687 650.51 805 005.71 934 1512 074 209.62 234 083.12 406 503.62 592 475.42 793 085.23 009 508.53 243 017.23 494 987.83 766 909.64 060 394.84 377 188.6160 102.1170 281.5181 187.2193 202.4206 415220 723.2237 064.3254 654.5273 592293 983.2315 942.9339 595.3365 074.6392 526.1422 106.8453 986.6385 792.6405 432.1426 257.7449 108.3474 104.2500 927531 601.9564 242.3598 979.1635 952.6675 312.4717 218.9761 843.2809 368.8859 991.6913 921.5234 937.2248 665263 310279 411.9297 075.1316 129.9337 890.7361 205.1386 187.9412 962.2441 660.8472 426.8505 413.7540 787.3578 725.8619 421.3282 515.3297 316.8313 030.7330 277.7349 152.5369 427.5392 603.9417 298.7443 615.2471 664501 563.7533 441567 431.7603 681.3642 345.7683 591.8201520162017201820192020202120222023202420252026202720282029203002M4M6M8M
Year CHINA INDIA JAPAN SOUTH KOREA REST OF ASIA PACIFIC
2015 $ 1481984.7 $ 160102.1 $ 385792.6 $ 234937.2 $ 282515.3
2016 $ 1581185.1 $ 170281.5 $ 405432.1 $ 248665.0 $ 297316.8
2017 $ 1687650.5 $ 181187.2 $ 426257.7 $ 263310.0 $ 313030.7
2018 $ 1805005.7 $ 193202.4 $ 449108.3 $ 279411.9 $ 330277.7
2019 $ 1934151.0 $ 206415.0 $ 474104.2 $ 297075.1 $ 349152.5
2020 $ 2074209.6 $ 220723.2 $ 500927.0 $ 316129.9 $ 369427.5
2021 $ 2234083.1 $ 237064.3 $ 531601.9 $ 337890.7 $ 392603.9
2022 $ 2406503.6 $ 254654.5 $ 564242.3 $ 361205.1 $ 417298.7
2023 $ 2592475.4 $ 273592.0 $ 598979.1 $ 386187.9 $ 443615.2
2024 $ 2793085.2 $ 293983.2 $ 635952.6 $ 412962.2 $ 471664.0
2025 $ 3009508.5 $ 315942.9 $ 675312.4 $ 441660.8 $ 501563.7
2026 $ 3243017.2 $ 339595.3 $ 717218.9 $ 472426.8 $ 533441.0
2027 $ 3494987.8 $ 365074.6 $ 761843.2 $ 505413.7 $ 567431.7
2028 $ 3766909.6 $ 392526.1 $ 809368.8 $ 540787.3 $ 603681.3
2029 $ 4060394.8 $ 422106.8 $ 859991.6 $ 578725.8 $ 642345.7
2030 $ 4377188.6 $ 453986.6 $ 913921.5 $ 619421.3 $ 683591.8
  • To Get Uninterrupted Charts Access Please Subscribe
  • Dedicated Client Service Manager
  • Dedicated Analyst Support
  • View access to 2 million data
Asia Pacific Silicon Dioxide Market Forecast (2015-2030)

Synopsis
The above chart is Global Silicon Dioxide market [2015-2030] by Asia Pacific

Market Dynamics

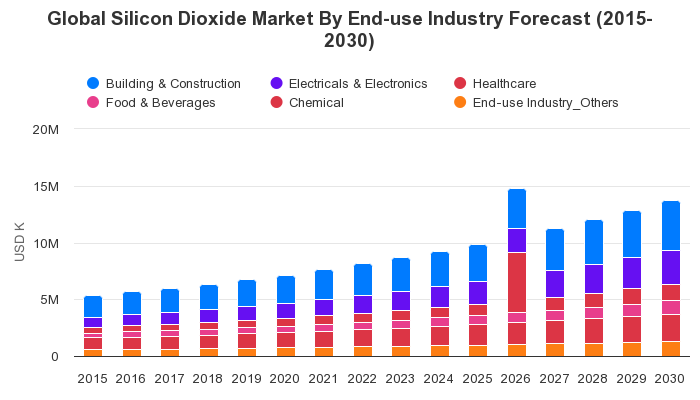
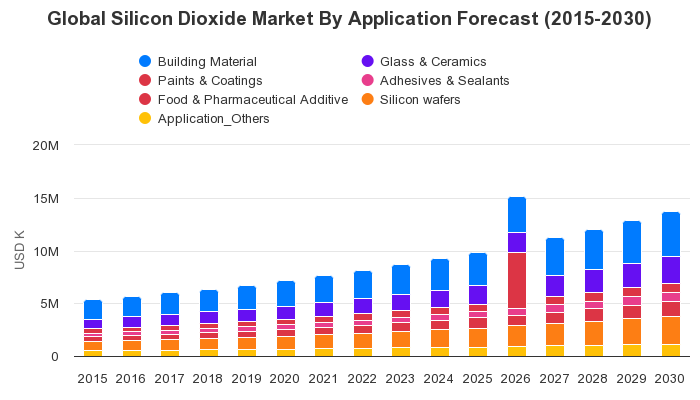
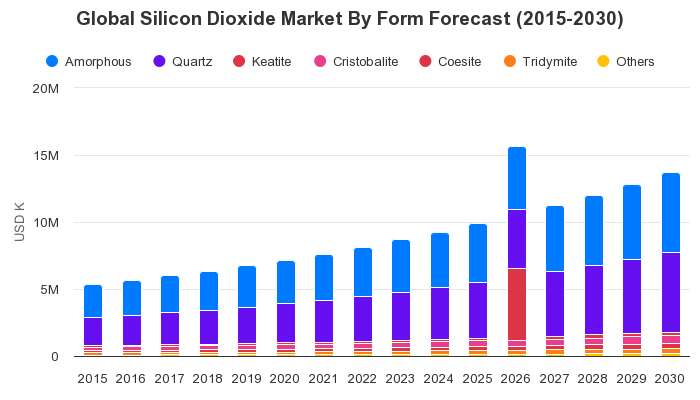
china accounted for the largest market share in 2017 in the asia pacific silicon dioxide market, and is expected to reach usd 4377188.60 k in 2030 from usd 1687650.50 k in 2017.this market is projected to grow at a cagr of 7.66% during the forecast period from 2018 - 2030. building and construction segment accounted for the largest market share in 2017, this market is expected to reach usd 2224743.90 k in 2030 from usd 1018288.40 k in 2017. this market is projected to grow at a cagr of 6.24% during the forecast period from 2018 - 2030. however, electricals and electronics segment is the fastest growing market, which is expected to grow at a cagr of 9.13% during the forecast period 2018 - 2030. amorphous segment accounted for the largest market share in 2017, this market is expected to reach usd 3041282.90 k in 2030 from usd 1308691.60 k in 2017. this market is projected to grow at a cagr of 6.75% during the forecast period from 2018 - 2030. however, quartz segment is the fastest growing market, which is expected to grow at a cagr of 7.99% during the forecast period 2018 - 2030. less than 99% purity segment accounted for the largest market share in 2017, this market is expected to reach usd 2483047.40 k in 2030 from usd 1101165.30 k in 2017. this market is projected to grow at a cagr of 6.51% during the forecast period from 2018 - 2030. however, 5n 99999% segment is the fastest growing market, which is expected to grow at a cagr of 9.06% during the forecast period 2018 - 2030. building material segment accounted for the largest market share in 2017, this market is expected to reach usd 2234322.20 k in 2030 from usd 994604.60 k in 2017. this market is projected to grow at a cagr of 6.47% during the forecast period from 2018 - 2030. however, silicon wafers segment is the fastest growing market, which is expected to grow at a cagr of 8.70% during the forecast period 2018 - 2030.

Further Content:You might find this interesting as well

Industries List

SINGLE SEAT SOLUTIONS FOR INDIVIDUALS AND SMALL BUSINESSES
Efficient research: Relevant data available at a click

Starter Account

$49 USD/month

* Billed Annually

  • Download XLS, PNG & PPT
  • View Access to 1 Million Data
  • View Access to Entire Platform

Single User Account

$625 USD/month

* Billed Annually

  • Dedicated Client Service Manager
  • Download XLS, PNG & PPT
  • View access to 2 million data
  • View Access to Entire Platform

Business Account

$899 USD/month

* Billed Annually

  • Dedicated Client Service Manager
  • Dedicated Analyst Support
  • Suggestive request box to accommodate new markets during subscription period
  • Access to the entire data & statistics with download rights for up to 10000 Premium statistics per 12 months without publication rights
  • View Access to Entire Platform
CONTACT

Closebutton

Stay Ahead with Exclusive Data!

Subscribe Now to Access Our Market Research Platform,and Charts
for B2B and B2C Industries. Empower Your Business with Insights