Asia Pacific Pneumatic Component Market Forecast (2018-2026)

Year AUSTRALIA CHINA INDONESIA INDIA JAPAN SOUTH KOREA REST OF ASIA PACIFIC
2018 $ 267.0 $ 2533.6 $ 205.8 $ 512.1 $ 888.9 $ 308.9 $ 360.3
2019 $ 273.4 $ 2656.3 $ 210.1 $ 528.3 $ 921.5 $ 317.2 $ 371.0
2020 $ 280.0 $ 2785.7 $ 214.5 $ 545.3 $ 955.7 $ 325.8 $ 382.2
2021 $ 287.4 $ 2927.2 $ 219.5 $ 564.0 $ 993.3 $ 335.4 $ 394.6
2022 $ 295.6 $ 3081.4 $ 225.1 $ 584.5 $ 1034.3 $ 345.9 $ 408.2
2023 $ 304.2 $ 3246.0 $ 231.1 $ 606.3 $ 1078.0 $ 357.1 $ 422.6
2024 $ 314.5 $ 3434.0 $ 238.2 $ 631.7 $ 1128.5 $ 370.3 $ 439.4
2025 $ 325.2 $ 3632.9 $ 245.6 $ 658.2 $ 1181.5 $ 383.9 $ 457.0
2026 $ 336.3 $ 3843.4 $ 253.2 $ 686.0 $ 1237.3 $ 398.2 $ 475.3
  • To Get Uninterrupted Charts Access Please Subscribe
  • Dedicated Client Service Manager
  • Dedicated Analyst Support
  • View access to 2 million data
Asia Pacific Pneumatic Component Market Forecast (2018-2026)

Synopsis
The above chart is Global Pneumatic Component market [2018-2026] by Asia Pacific

Market Dynamics

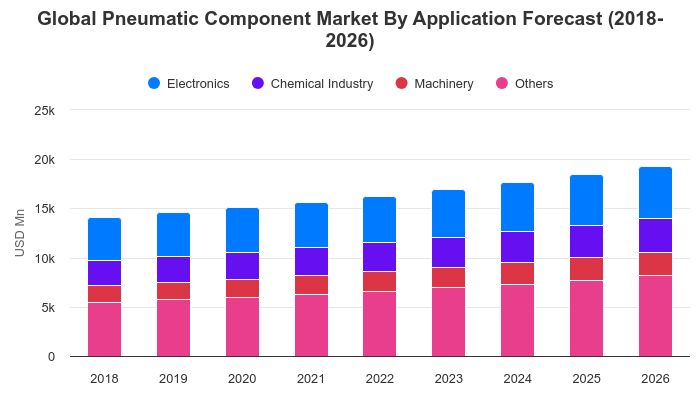
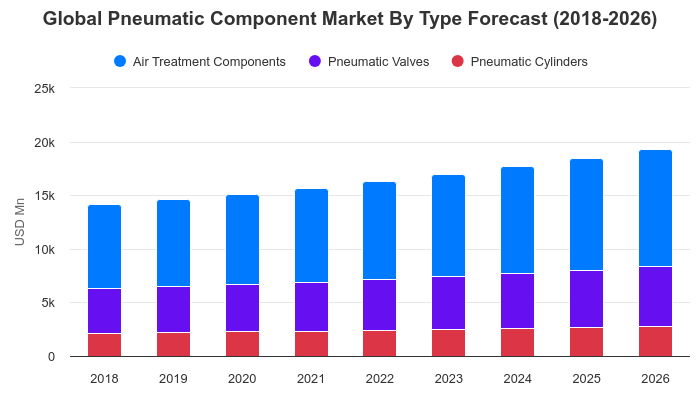
china accounted for the largest market share in 2019 in the asia pacific pneumatic component market, and is expected to reach usd 3843.40 million in 2026 from usd 2656.30 million in 2019.this market is projected to grow at a cagr of 5.51% during the forecast period from 2020 - 2026. air treatment components segment accounted for the largest market share in 2019, this market is expected to reach usd 4053.40 million in 2026 from usd 2884.30 million in 2019. this market is projected to grow at a cagr of 5.08% during the forecast period from 2020 - 2026. however, air treatment components segment is the fastest growing market, which is expected to grow at a cagr of 5.08% during the forecast period 2020 - 2026. others segment accounted for the largest market share in 2019, this market is expected to reach usd 3101.60 million in 2026 from usd 2087.90 million in 2019. this market is projected to grow at a cagr of 5.92% during the forecast period from 2020 - 2026.

Further Content:You might find this interesting as well

Industries List

SINGLE SEAT SOLUTIONS FOR INDIVIDUALS AND SMALL BUSINESSES
Efficient research: Relevant data available at a click

Starter Account

$49 USD/month

* Billed Annually

  • Download XLS, PNG & PPT
  • View Access to 1 Million Data
  • View Access to Entire Platform
Single User Account

$599 USD/month

* Billed Annually

  • Dedicated Client Service Manager
  • Download XLS, PNG & PPT
  • View access to 2 million data
  • View Access to Entire Platform

Business Account

$899 USD/month

* Billed Annually

  • Dedicated Client Service Manager
  • Dedicated Analyst Support
  • Suggestive request box to accommodate new markets during subscription period
  • Access to the entire data & statistics with download rights for up to 10000 Premium statistics per 12 months without publication rights
  • View Access to Entire Platform
CONTACT

Closebutton

Stay Ahead with Exclusive Data!

Subscribe Now to Access Our Market Research Platform,and Charts
for B2B and B2C Industries. Empower Your Business with Insights