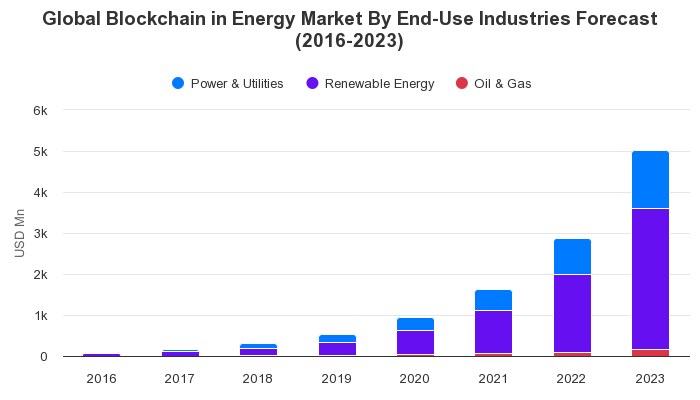
Asia Pacific Blockchain in Energy Market By End-Use Industries Forecast (2016-2023)
The above chart is Global Blockchain in Energy market [2016-2023] Asia Pacific by End-Use Industries
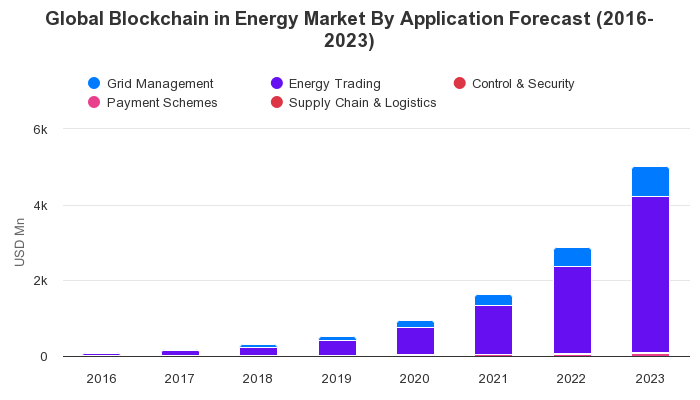
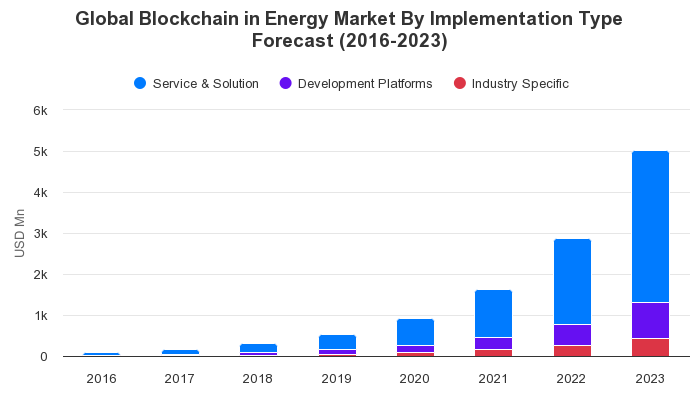
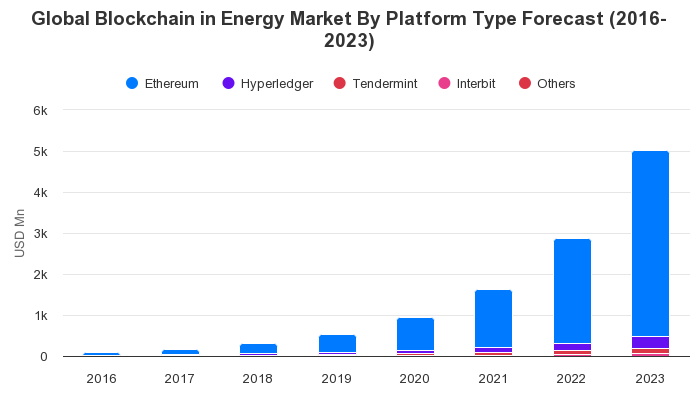
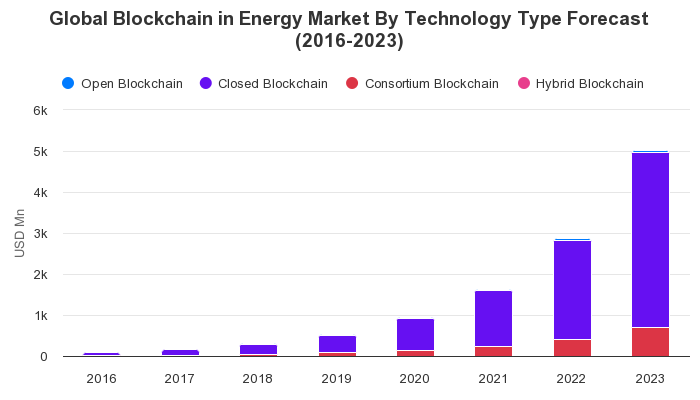
australia accounted for the largest market share in 2017 in the asia pacific blockchain in energy market, and is expected to reach usd 214.40 million in 2023 from usd 10.20 million in 2017.this market is projected to grow at a cagr of 66.21% during the forecast period from 2018 - 2023. service and solution segment accounted for the largest market share in 2017, this market is expected to reach usd 233.60 million in 2023 from usd 11.20 million in 2017. this market is projected to grow at a cagr of 66.06% during the forecast period from 2018 - 2023. however, service and solution segment is the fastest growing market, which is expected to grow at a cagr of 66.06% during the forecast period 2018 - 2023. ethereum segment accounted for the largest market share in 2017, this market is expected to reach usd 287.70 million in 2023 from usd 13.80 million in 2017. this market is projected to grow at a cagr of 65.89% during the forecast period from 2018 - 2023. closed blockchain segment accounted for the largest market share in 2017, this market is expected to reach usd 265.70 million in 2023 from usd 12.90 million in 2017. this market is projected to grow at a cagr of 65.65% during the forecast period from 2018 - 2023. however, closed blockchain segment is the fastest growing market, which is expected to grow at a cagr of 65.65% during the forecast period 2018 - 2023. energy trading segment accounted for the largest market share in 2017, this market is expected to reach usd 249.70 million in 2023 from usd 11.40 million in 2017. this market is projected to grow at a cagr of 67.39% during the forecast period from 2018 - 2023. however, energy trading segment is the fastest growing market, which is expected to grow at a cagr of 67.39% during the forecast period 2018 - 2023. renewable energy segment accounted for the largest market share in 2017, this market is expected to reach usd 215.00 million in 2023 from usd 9.60 million in 2017. this market is projected to grow at a cagr of 68.14% during the forecast period from 2018 - 2023. however, renewable energy segment is the fastest growing market, which is expected to grow at a cagr of 68.14% during the forecast period 2018 - 2023.